Get your Own Copy for FREE!
Introduction to Squery’s Power BI Dashboard
In the current digital era, grasping user behavior on websites is essential for businesses striving to succeed in the online space. With the evolution of Google Analytics to its latest version, GA4, the landscape of web analytics has shifted towards more insightful and comprehensive data collection. Leveraging this advancement, Squery has developed a powerful tool within Power BI, offering businesses a deeper dive into their website performance across multiple platforms.
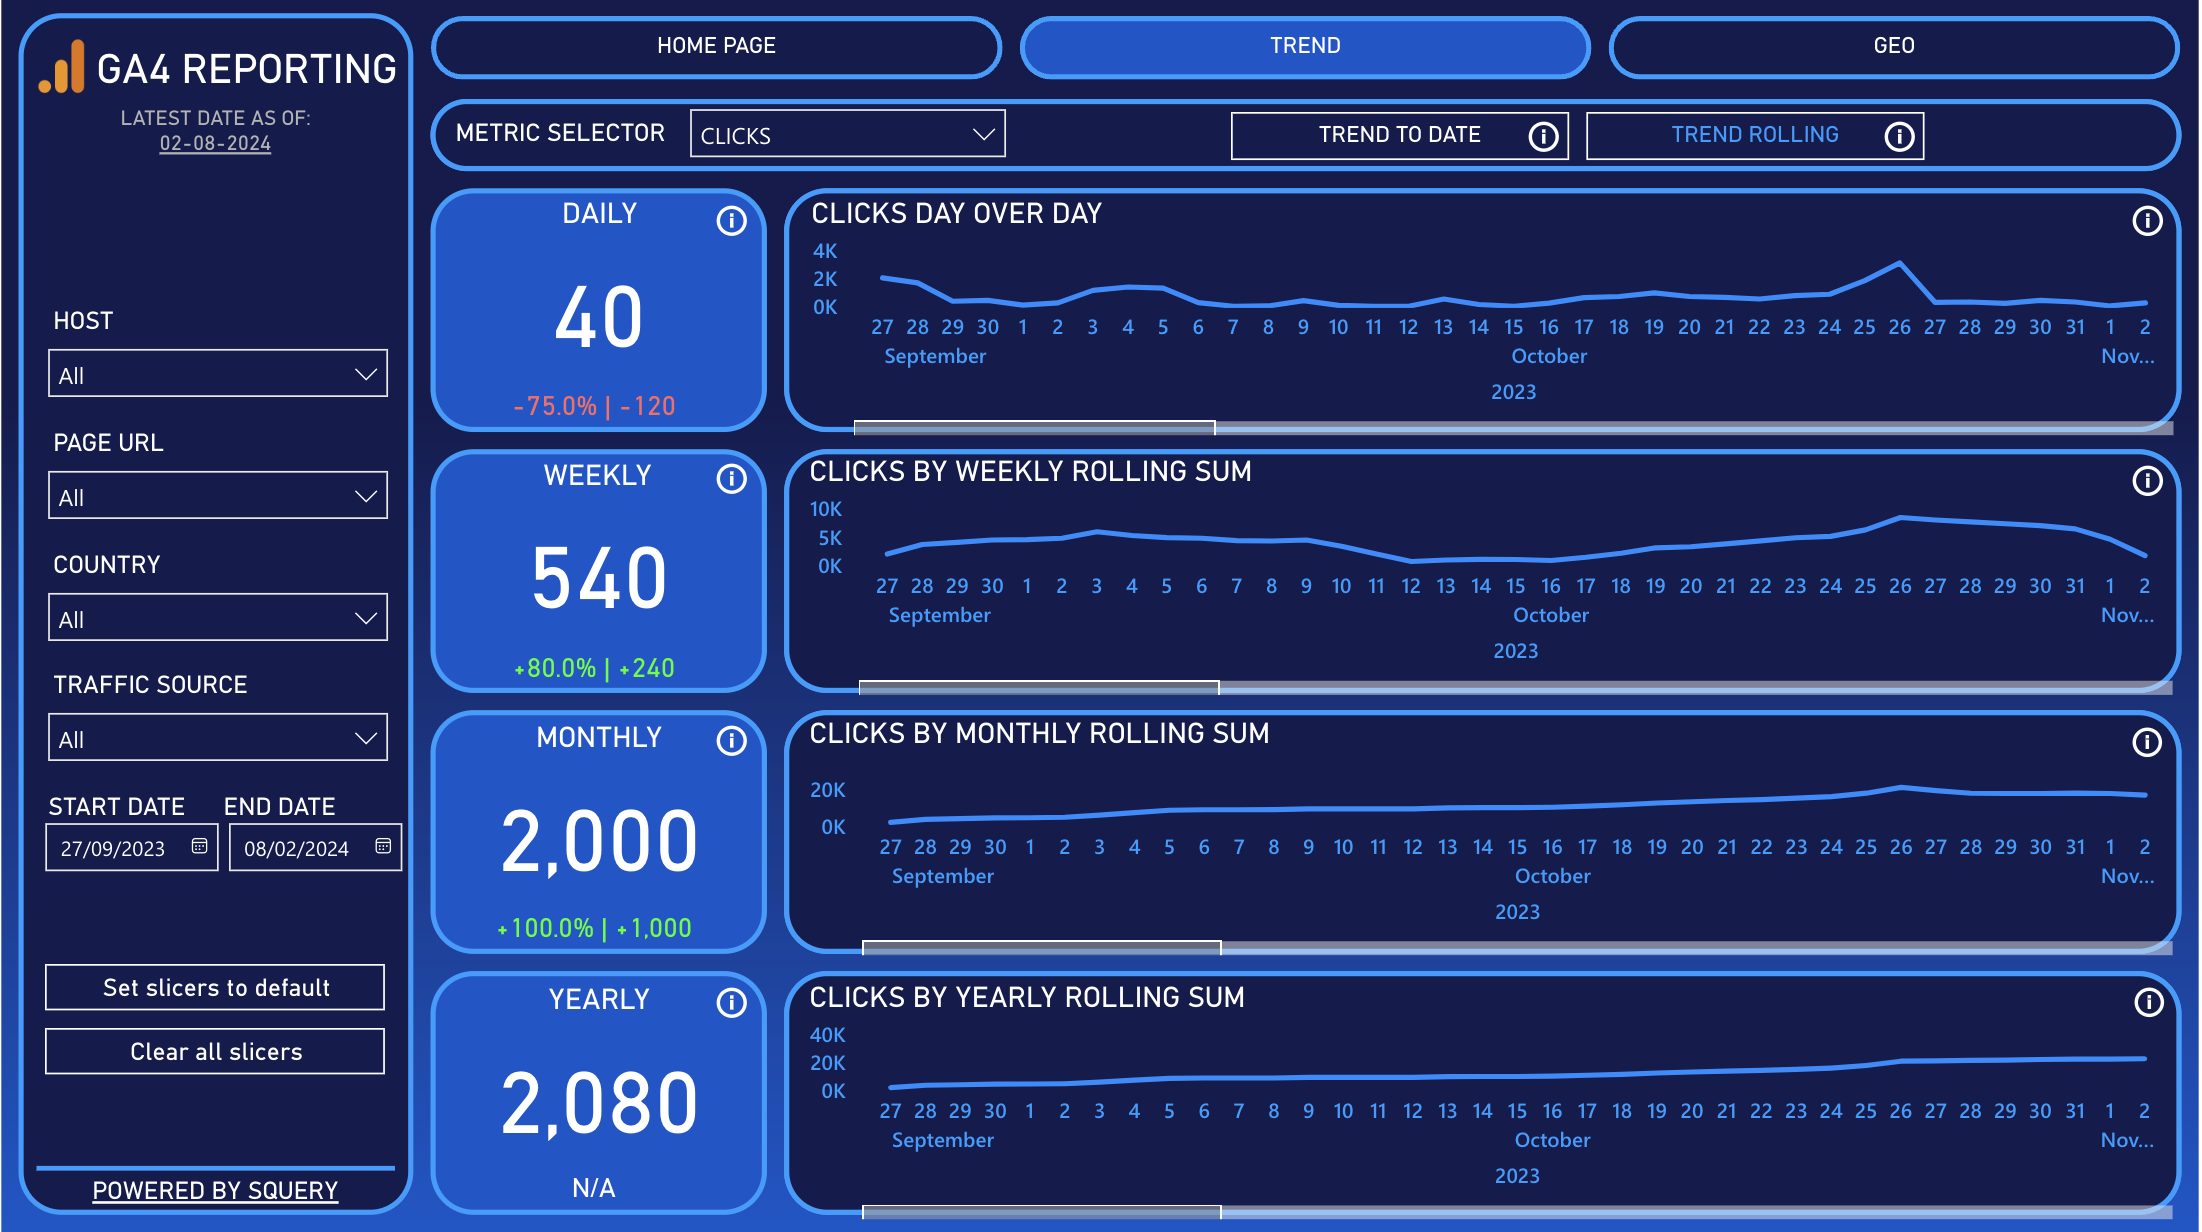
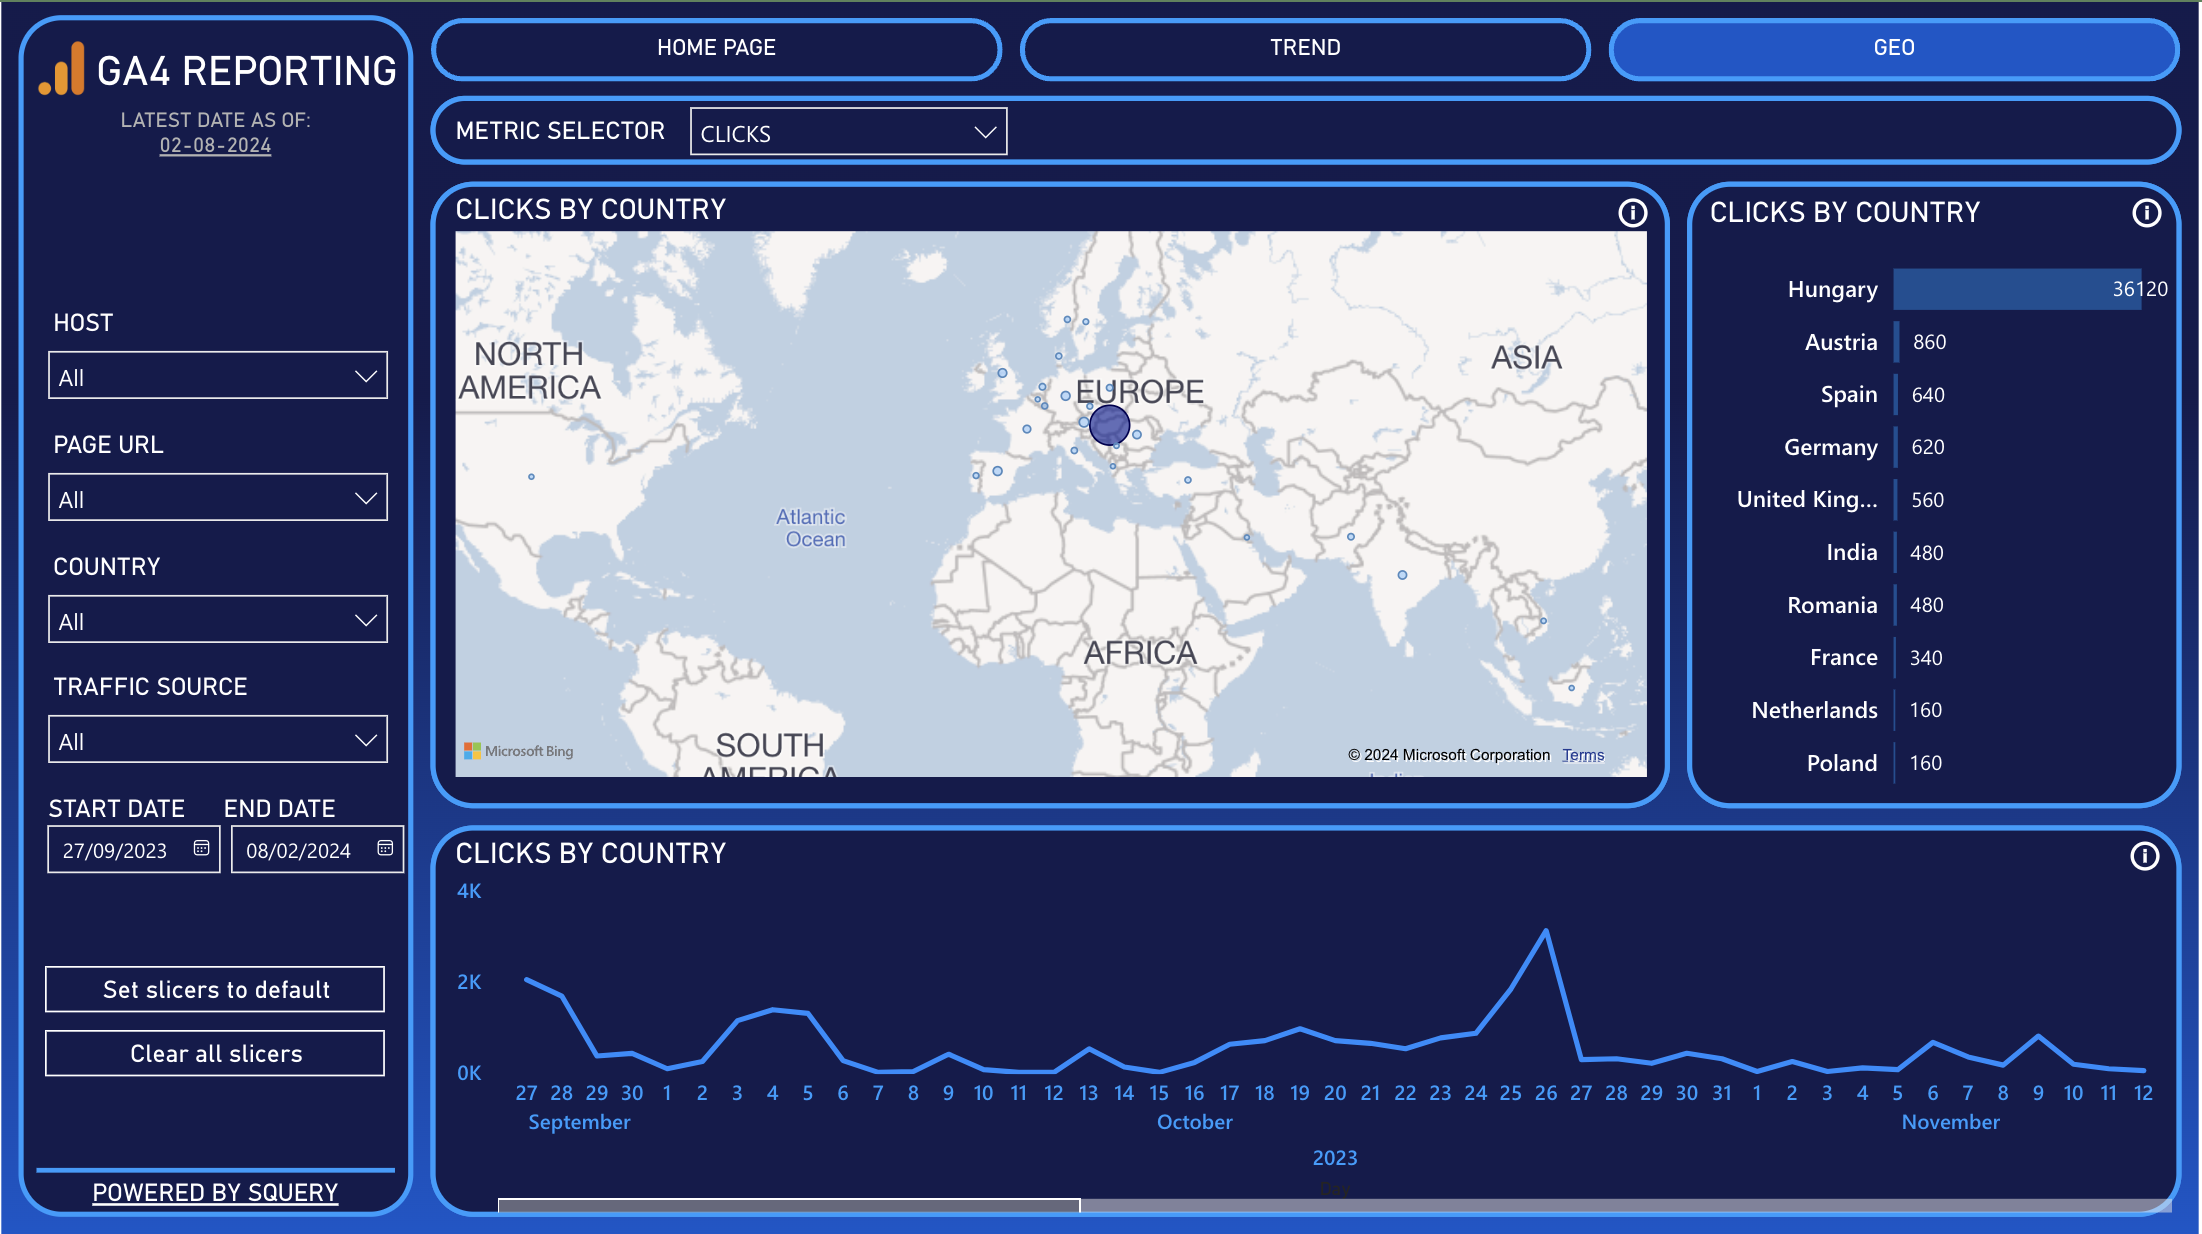
Squery’s Power BI Dashboard harnesses the capabilities of GA4, Google’s next-generation analytics platform, to provide businesses with a holistic view of their online presence. By integrating data from various websites, this dashboard offers a comprehensive analysis of Key Performance Indicators (KPIs) and their trends over time. Additionally, it presents geographical distribution insights, enabling businesses to tailor their strategies to specific regions.

Analyzing KPI Trends
One of the primary features of Squery’s Power BI Dashboard is its ability to track and visualize KPI trends across multiple websites. Whether it’s website traffic, conversion rates, or user engagement metrics, this dashboard compiles and displays the data in intuitive graphs and charts. By observing these trends over time, businesses can identify patterns, make data-driven decisions, and optimize their online performance accordingly.

Unveiling Geographic Distribution Insights
Understanding where website visitors are located is crucial for businesses targeting specific regions or demographics. Squery’s Power BI Dashboard utilizes GA4 data to present a detailed geographical distribution of website traffic. Through interactive maps and geospatial visualizations, businesses can pinpoint areas of high activity, identify emerging markets, and tailor their marketing strategies to cater to regional preferences and behaviors.

Empowering Data-Driven Decision Making
With Squery’s Power BI Dashboard, businesses gain access to a wealth of actionable insights derived from GA4 data. By visualizing KPI trends and geographical distribution patterns, stakeholders can make informed decisions to optimize website performance, enhance user experience, and drive business growth. Whether it’s refining marketing strategies, improving website content, or targeting specific regions, the dashboard equips businesses with the tools they need to succeed in the digital landscape.
Get your Own Copy for FREE!